
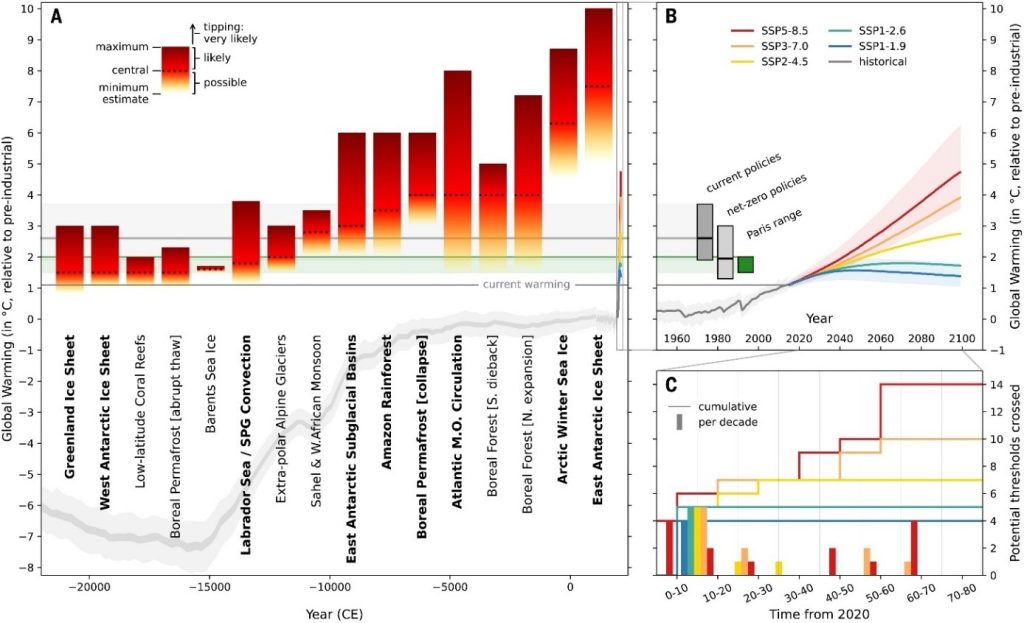
Tipping elements (A) relative to IPCC Shared Socioeconomic Pathways (SSP) projections and likely future scenarios given current policies and targets (B) and how many thresholds may be crossed per SSP projection (C).

Financial Markets As Accelerators Towards Net Zero Targets
Over 40 years, Climate Change is still being debated and partially acted on, yet not enough of that has translated into...

Ocean Heat And Its Climate Implications On Humans And Ecosystems Around The World
This weakening of winds affects oceans and land around the world...

Exceeding 1.5oC Global Warming Risks Triggering Multiple Climate Tipping Points
Maps showing the Global core...
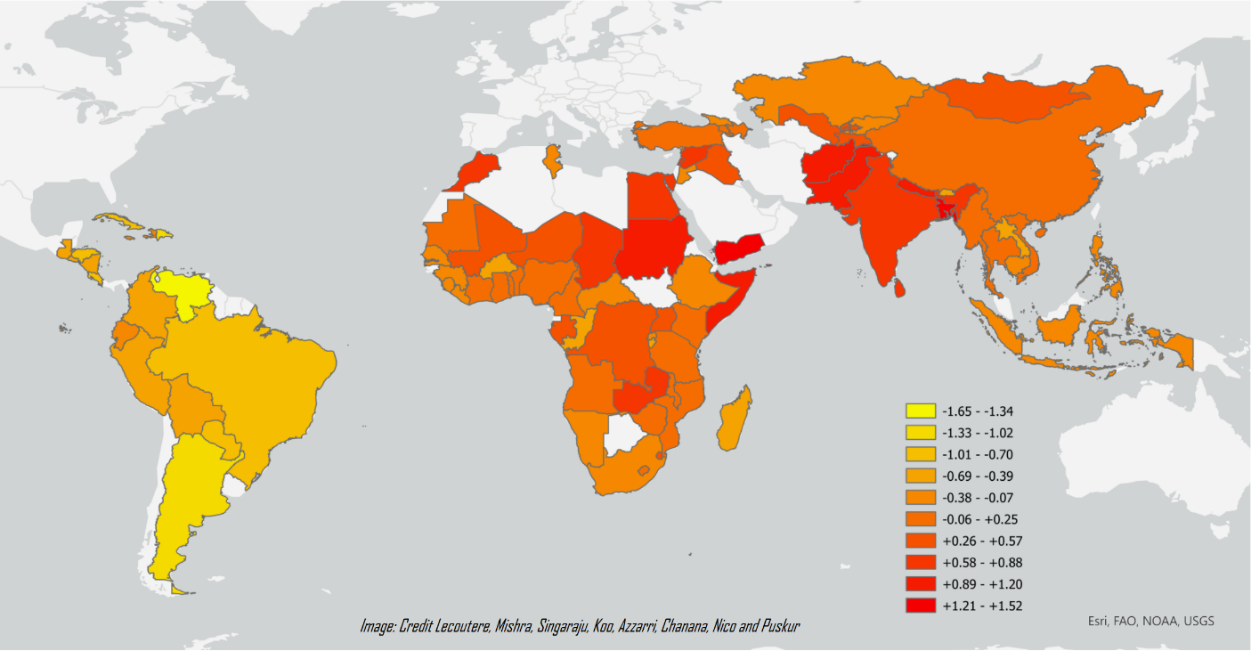
Inequality Hotspots Where Women In Agriculture Are Hit The Hardest By The Climate Crisis In 2023.
The climate-agriculture-gender inequality hotspot risk index captures the convergence...

National GHG Emissions Per Capita From The Healthcare Sector In 2020.
Quality healthcare requires use of energy, products, services, and infrastructure, all of which contribute to...

“Committed Global Warming” Risks Triggering Multiple Climate Tipping Points.
Committed global warming is one that continues after GHG emissions are held constant until a new thermal balance is achieved (much like turning a...